
Figure 4.
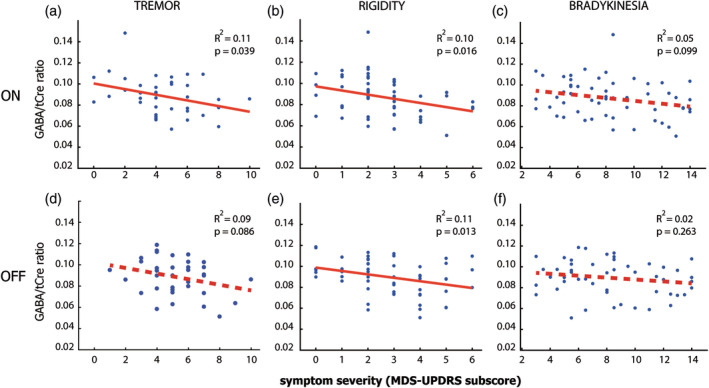
Relationship between motor cortex GABA and motor symptom severity. This figure shows scatterplots of the relationship between GABA/tCre in the motor cortex and MDS‐UPDRS subscores on the most affected side, during ON medication (upper row) and OFF medication (bottom row). The MDS‐UPDRS subscores concern tremor (nonkinetic tremor: Items 15 and 17), (Panels a and b), rigidity (Item 3) (Panels c and d), and bradykinesia (Items 4–8 and 14) (Panels e and f). For definition of subscores, see Table 1. Significant correlations are marked with a continuous red line. We find the most consistent correlation for rigidity both ON and OFF medication, followed by tremor with a significant correlation for tremor ON medication, and at trend level OFF medication. Bradykinesia showed a marginal trend‐level correlation ON medication, but no effect OFF medication, showing that rigidity scores match the results best, but the relationship between motor cortex GABA and symptom severity does not differ markedly between symptom type. GABA, gamma‐aminobutyric acid; MDS‐UPDRS, Movement Disorders Society Unified Parkinson's Disease Rating Scale; tCre, total creatine