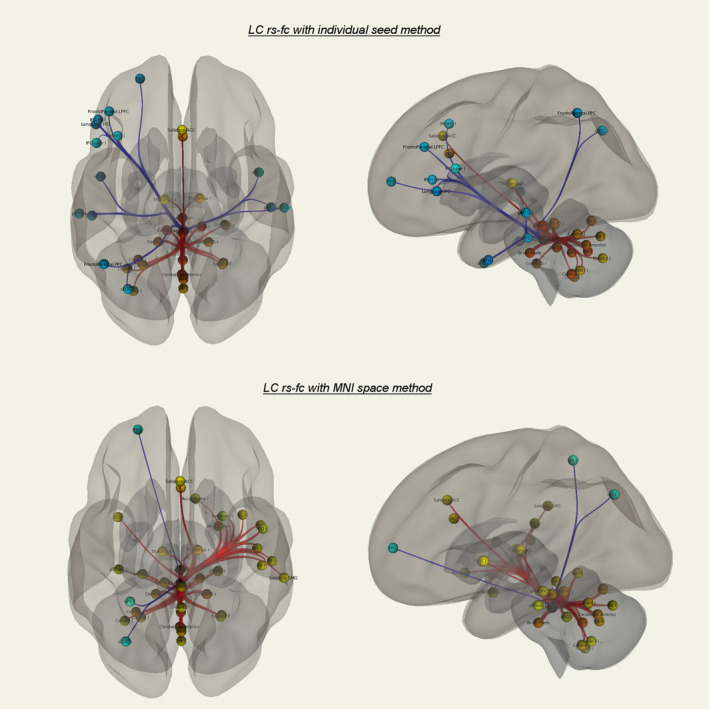
Figure 4.

ROI's with significant LC rs‐fc in the individual seed (top row) and MNI space (bottom row) method. Red: positive connectivity, blue: negative connectivity (all presented regions FDR p < .05). For detailed significance values see Tables 3 and 4. No significant differences of both approaches in ROI‐to‐ROI analysis in direct comparison, although differences in connectivity significance to some frontotemporoparietal regions are visible. Similar strong rs‐fc of LC to ACC, bilateral thalamus, and bilateral cerebellum in both approaches
