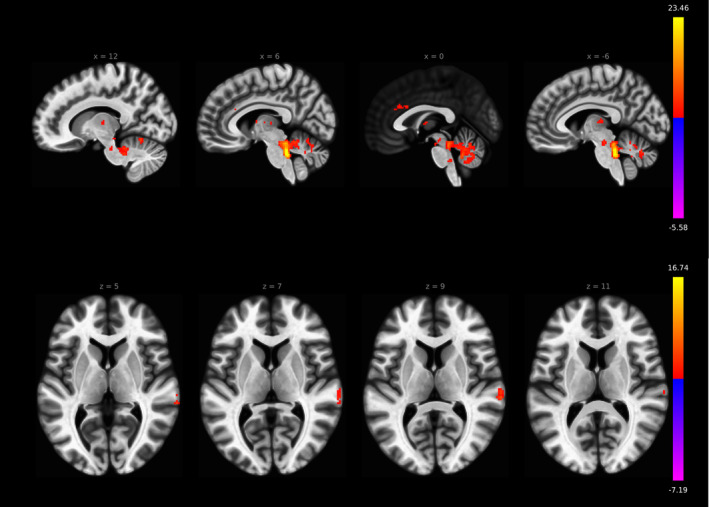
Figure 6.

LC rs‐fc in the seed‐to‐voxel analysis reveals significant connectivity to ACC (FDR p < .001, cluster size 48), bilateral thalamus (left thalamus FDR p < .001, cluster size 60; right thalamus p < .01, cluster size 24), bilateral cerebellum (FDR p < .001, cluster size 1,120), and right TPJ (FDR p < 0.001, cluster size 77) in the MNI space mask approach
