
Figure 5.
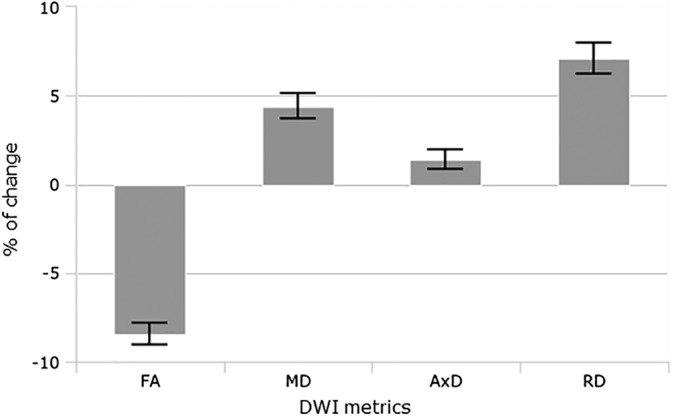
Mean percentage of change of DWI metrics compared in equivalent brain locations between WMH and NAWM. WMH showed significant lower FA and increased diffusivity. RD shows significantly larger changes than in AxD in WMH. All the differences were statistically significant at p < .001. Error bars show 95% of CI. AxD, axial diffusivity; DWI, diffusion‐weighted imaging; FA, fractional anisotropy; MD, mean diffusivity; RD, radial diffusivity