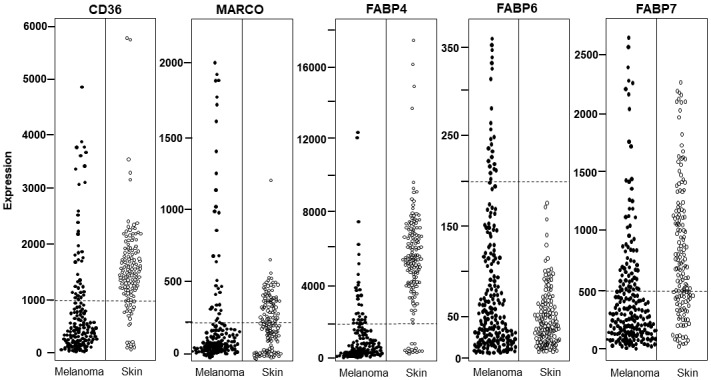
Figure 1.

Expression of CD36, MARCO, FABP4, FABP6, and FABP7 in melanoma and healthy skin samples from the IST (In Silico Transcriptomics) Online data set. Each dot indicates one individual and dashed lines indicate the threshold used to calculate the statistical significance of the distribution difference reported in Table 2. All reported genes show a significantly different distribution in melanoma versus controls according to the Fisher exact test (P<.001).
