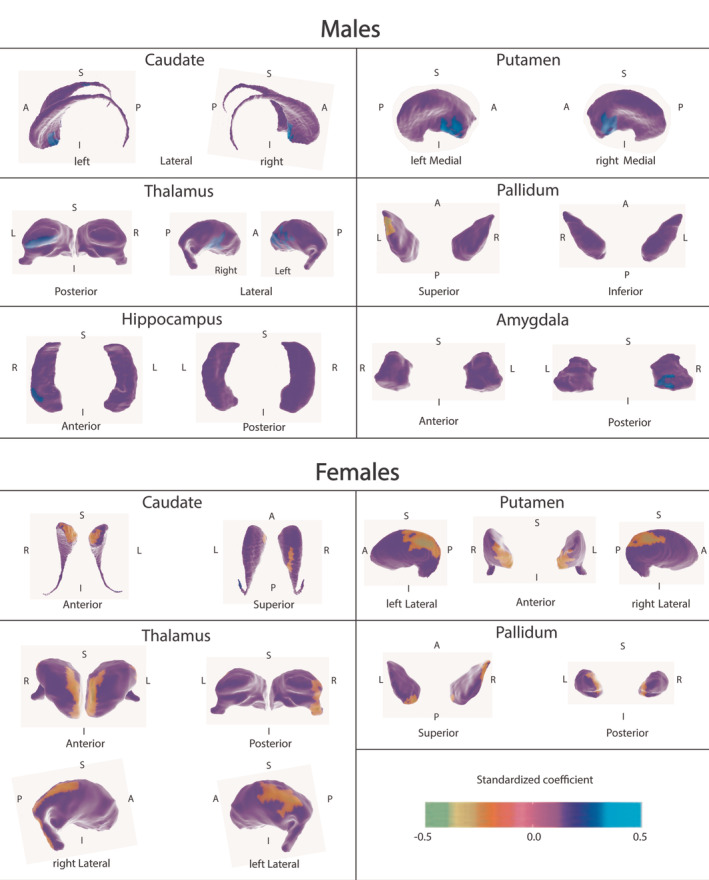
Figure 1.

Regression of local shape variation onto Income: Poverty ratio for males and females, with age, puberty category, and intracranial volume as covariates. In regions with warmer colors, lower IPR is related to more outward local shape variation. Vertex‐wise RFT corrected FWER cluster threshold p < .01 within each ROI, FWER p < .007 per ROI, Bonferroni corrected for multiple comparisons. In regions with cooler colors, lower IPR is related to more inward local shape variation. Note: A, anterior; FWER, family‐wise error rate; I, inferior; IPR, Income: Poverty ratio; L, left; P, posterior; RFT, random field theory; R, right; ROI, region of interest; S, superior. Figure S1 shows these structures in their correct anatomical relationship with each other, as they appear in situ
