
Figure 3.
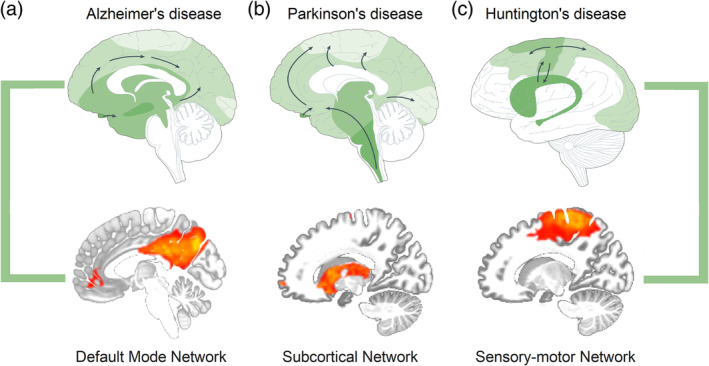
Progression of neuropathological changes in Alzheimer's, Parkinson's, and Huntington's disease (top row) overlapping with specific neural networks (bottom row). Functional connectivity maps were extracted through independent component analysis from a sample of 22 healthy individuals. Figure is adapted from Brundin, Melki, and Kopito (2010) with permission from Springer Nature