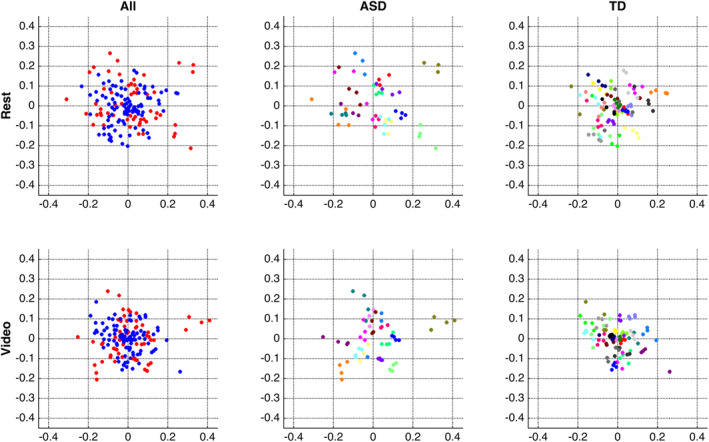
Figure 1.

Multidimensional scaling (MDS) visualizations of pairwise similarity among all rest scans (top row) and among all video scans (bottom row). Both MDS computations were conducted using all subjects (left column); results are also re‐plotted separately for each group (ASD, middle column; TD, right column) for closer inspection. The middle and right columns plot scans from the same subject in the same color (note that colors are recycled across groups, i.e., the orange points in the middle and in the right plots represent different subjects). Note that these visualizations present pairwise similarity before regressing out FDfilt
