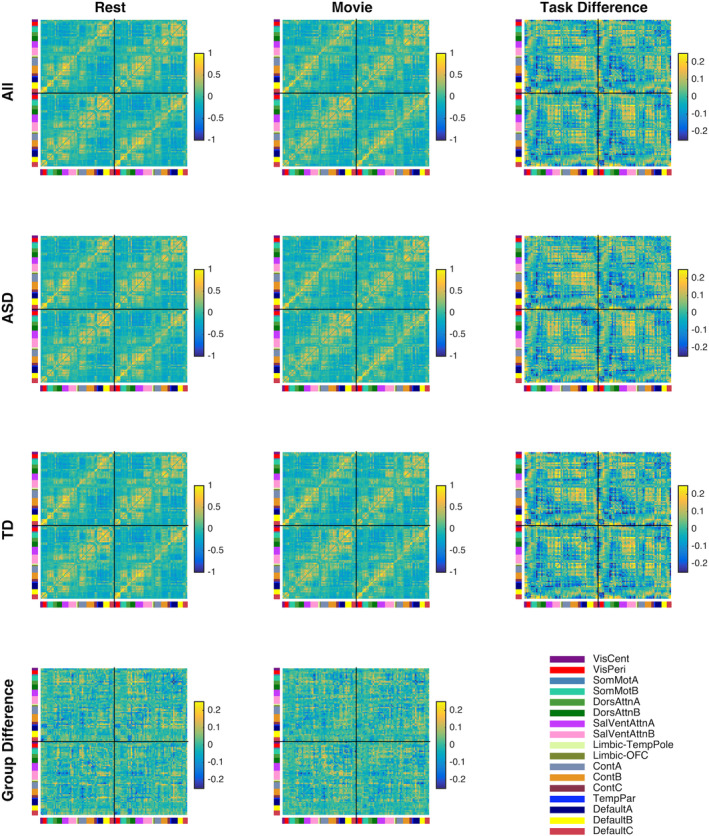
Figure 2.

Median and difference functional connectivity matrices for each scan task across all subjects (Row 1), for each diagnosis group (Rows 2 and 3), and differences between diagnosis groups for each task (Row 4). Task differences (Column 3) are more apparent upon visual inspection than group differences (Row 4). Differences are ordered as ASD‐TD (Row 4) and Video‐Rest (Column 3). Left hemisphere ROIs are plotted to the left and above right hemisphere ROIs
