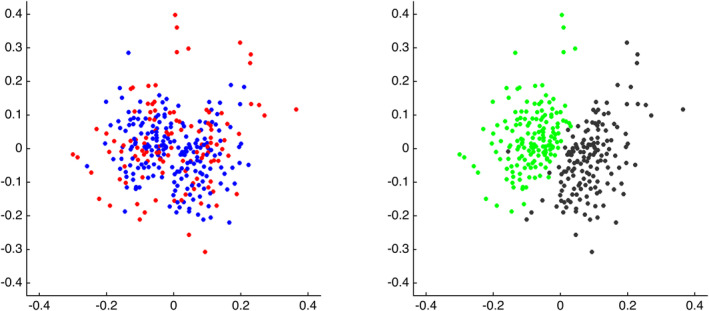
Figure 3.

MDS visualizations of pairwise similarity among all scans. Left: scans color‐coded according to diagnosis (red = ASD, blue = TD). Right: scans color‐coded according to scan type (green = video; black = rest). Note that these visualizations present pairwise similarity before regressing out FDfilt
