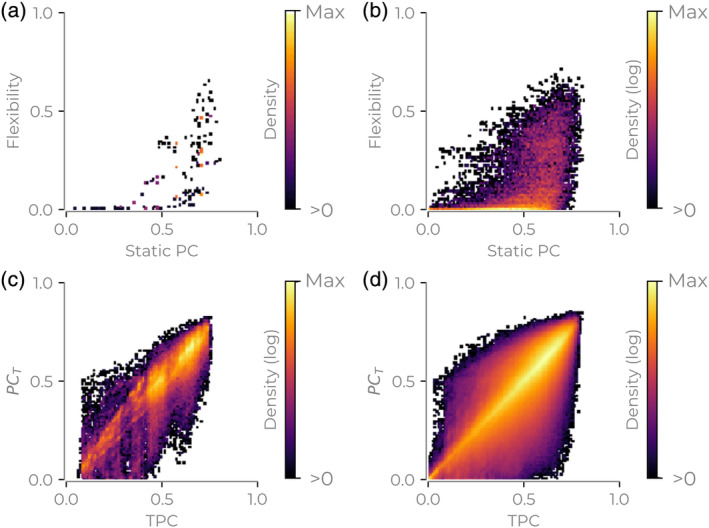
Figure 4.

Differences between TPC and PC T. (a) Static participation coefficient (PC) versus the flexibility for one subject/session. (b) Same as (a) but for all subjects. (c) Temporal PC versus the PC per time point with temporal communities for one subject/session. (d) Same as (c), but for all subjects. All color bars show density on a 100 × 100 grid. Panels (b–d) show logarithmic range between colors
