
Figure 2.
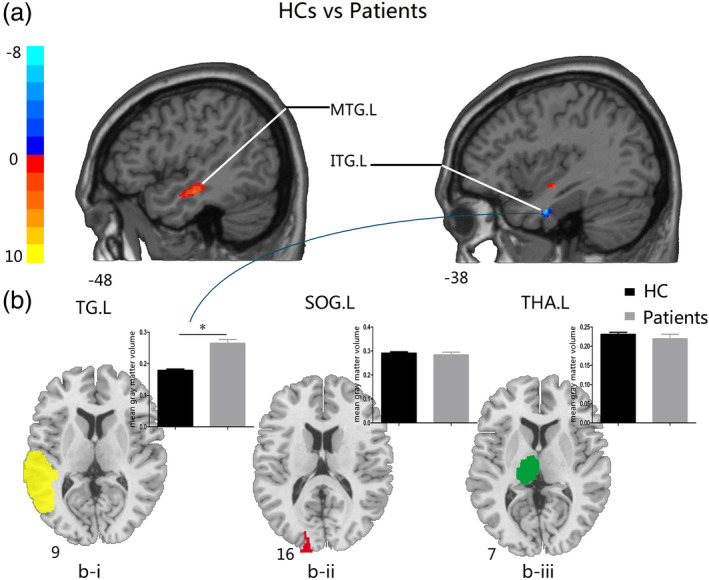
Comparisons of GM volume between HCs and patients with glioma in the right temporal lobe before surgery. (a) The two‐sample t test map between HCs and glioma patients with the TG.L mask after controlling effects for age, gender, education, and total intracranial volume (FDR corrected p‐value of <.001). (b) (i) The two‐sample t test of GM volume between groups on the significantly increased brain areas in patients with glioma in the left temporal gyrus (left, green); (ii) the two‐sample t test of GM volume between groups in the left superior occipital gyrus (middle, red); (iii) the two‐sample t test of GM volume between groups in the left thalamus (right, green). Abbreviations: FDR, false discovery rate; GM, gray matter; HCs, healthy controls; ITG.L, left inferior temporal gyrus; MTG.L, left middle temporal gyrus; SOG.L, left superior occipital gyrus; TG.L, left temporal gyrus; THA.L, left thalamus