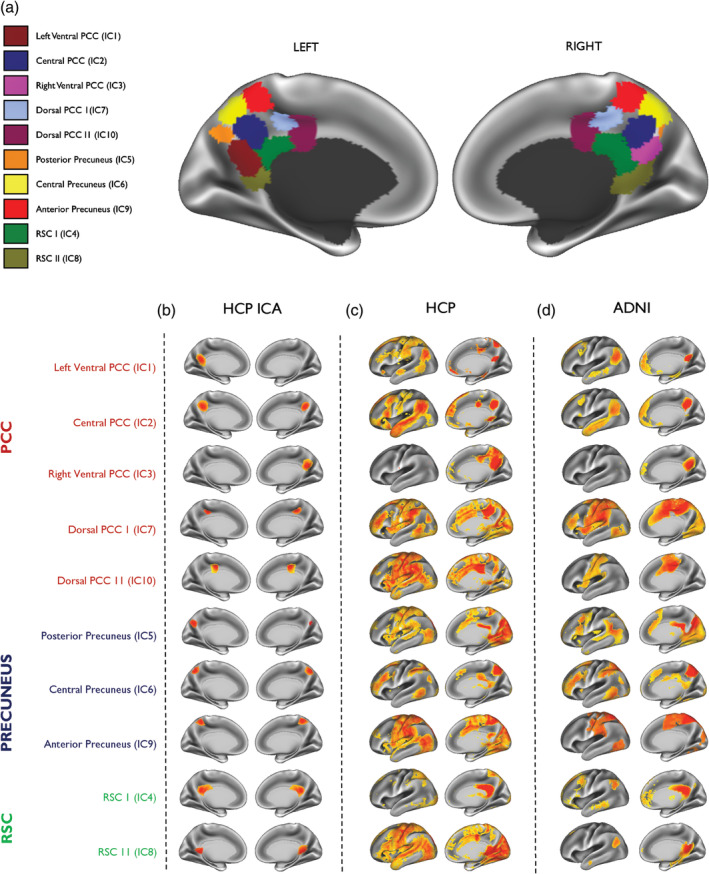
Figure 2.

Subdivisions of the posteromedial cortex and their associated brain networks in the HCP cohort and ADNI patient dataset. (a) A parcellation map showing the location of all subdivisions defined in the posteromedial cortex (PMC) using the HCP dataset. (b) The location of each PMC subdivision is shown separately on the far left. Each subdivision (displayed as left and right medial hemispheres) is numbered by its ICA component and highlighted as anatomically representing the posterior cingulate cortex (PCC) in red, precuneus in blue and the retrosplenial cortex (RSC) in green. The whole‐brain network (displayed as left lateral and right medial hemisphere) of the corresponding PMC subdivision is shown for (c) the HCP dataset and (d) the ADNI patient dataset (N = 155). Warmer colours indicate areas of high functional connectivity. All maps are thresholded at p < .05 and are family‐wise‐error corrected for multiple comparisons
