
Figure 2.
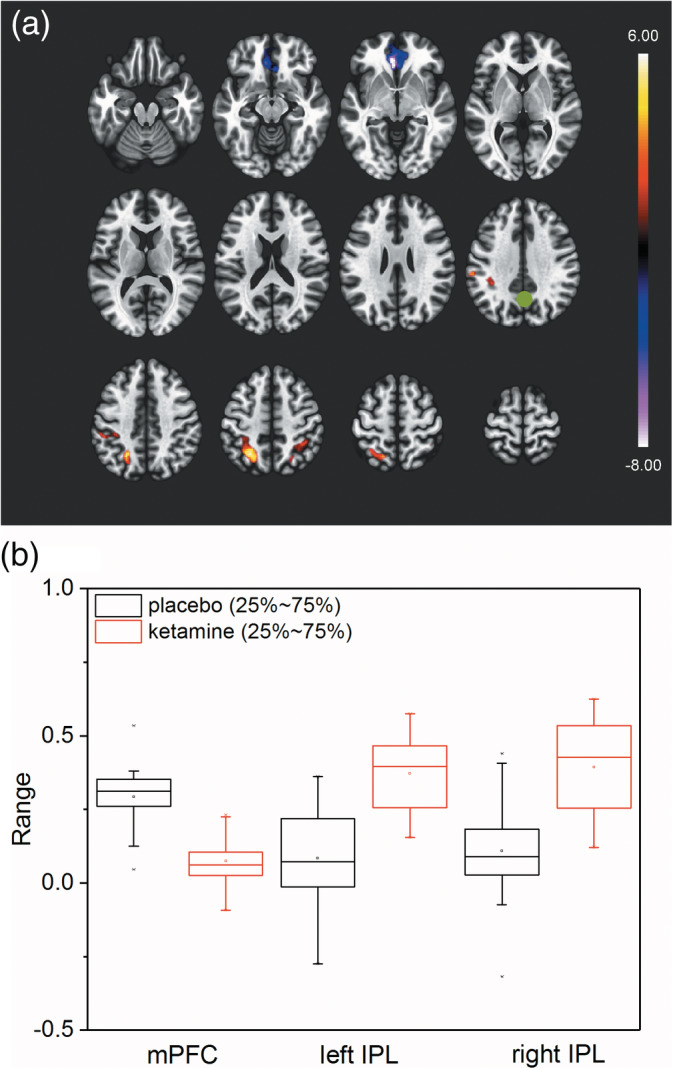
The ketamine effect on seed‐based functional connectivity. (a) Significant T‐values (two‐sided) of seed to voxel functional connectivity for ketamine > placebo comparison (FWE cluster‐corrected: p FWE = .002). Seed (marked as green dot) is centered at 1, −61, 38 (MNI) and covers PCC/precuneus area. Significant clusters cover mPFC (decreased connectivity) and left and right IPL areas (increased connectivity). (b) Boxplot of individual mean Fisher Z‐transformed functional connectivities for placebo (black) and ketamine (red) condition for the different significant clusters. Of further interest, for ketamine condition, mPFC connectivities were close to zero. Same could be observed for left and right IPL connectivities for placebo condition