
Figure 3.
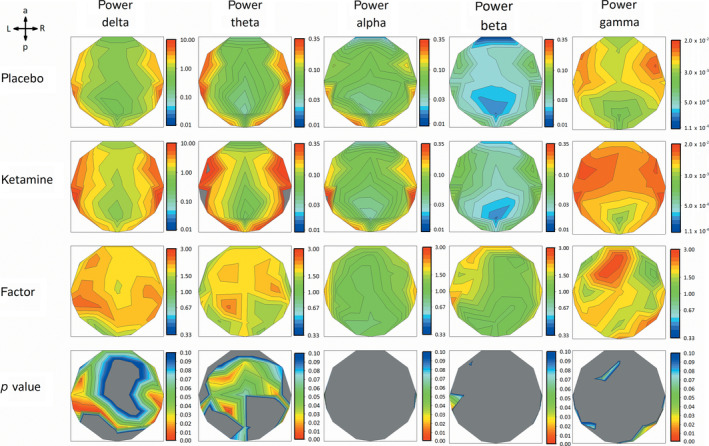
Row 1 and 2 show heatmaps of geometric mean FFTP for all 30 electrodes of placebo and ketamine condition for five frequency bands (delta: 0.53–4 Hz; theta: 4–8 Hz; alpha: 8–12 Hz; beta: 12–25 Hz; gamma: 30–50 Hz). Row 3 shows heatmaps of factors of how the GM FFTP of the two conditions scale to each other (red = higher GM FFTP for ketamine condition, blue = higher GM FFTP for placebo condition, green = equal GM FFTP). Please note logarithmic scaling for row 1 to 3. Row 4 shows heatmaps of uncorrected p values <.1 (one‐way repeated measure ANOVA, blue p < .1, green p < .05, red p < .001). Despite of some electrodes, in alpha and beta, no clustering of electrodes shows neither high scaling factors, nor significant differences between conditions. In delta and theta, cluster of electrodes with high scaling factors and significantly different (p < .05) FFTP over conditions were observable for parietal‐temporal regions and fronto‐central regions, respectively. Highest scaling factors could be seen in fronto‐central electrodes for gamma but without significant difference (p < .05) between conditions