
Figure 5.
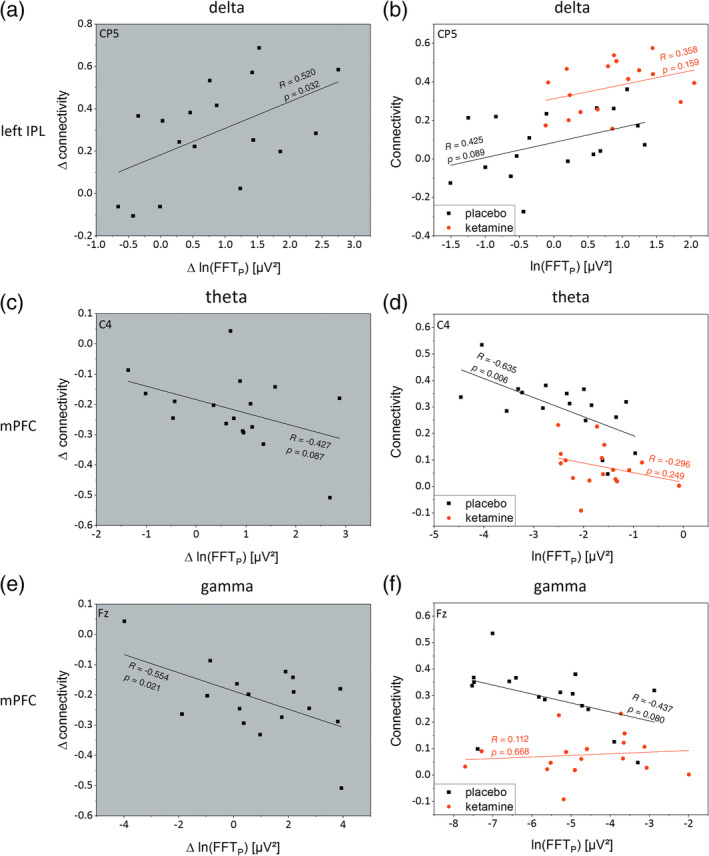
Plots with gray background show the individual difference (ketamine − placebo) of the logarithmic EEG Power (Δln[FFTP]) against the matching individual difference of default mode network functional connectivity (Δconnectivity). Plots with white background show the individual ln(FFTP) against corresponding functional connectivity for placebo (black) and ketamine condition (red) with associated linear regressions (lines). (a) For delta, an increase in Δln(FFTP) of electrode CP5 is significantly accompanied with an increased Δ in left IPL‐PCC/precuneus functional connectivity with a Pearson's R of 0.52 (p = .032). This is related to the right shifted parallel offset of the linear regression of ketamine condition shown in (b) with higher FFTP and functional connectivity values for ketamine condition. (c, d) A comparable analysis of theta for C4 electrode and DMN functional connectivity between mPFC and PCC/precuneus shows a trend‐wise negative correlation for Δ analysis with a significant decreased correlation for placebo condition (R = −0.635, p = .006). For ketamine condition, a floor effect with connectivity values close to zero could be observed which leads to low Pearson's R of −0.296 (p = .249). (e, f) Analyzing ln(FFTP) of gamma for electrode Fz against DMN functional connectivity of mPFC, comparable results with a significant negative correlation for Δ analysis and a trend‐wise negative correlation between ln(FFTP) and functional connectivity for placebo condition could be seen. Because of the aforementioned floor effect of ketamine related DMN functional connectivity of mPFC, a correlation between ln(FFTP) and DMN functional connectivity for ketamine condition could not be observed