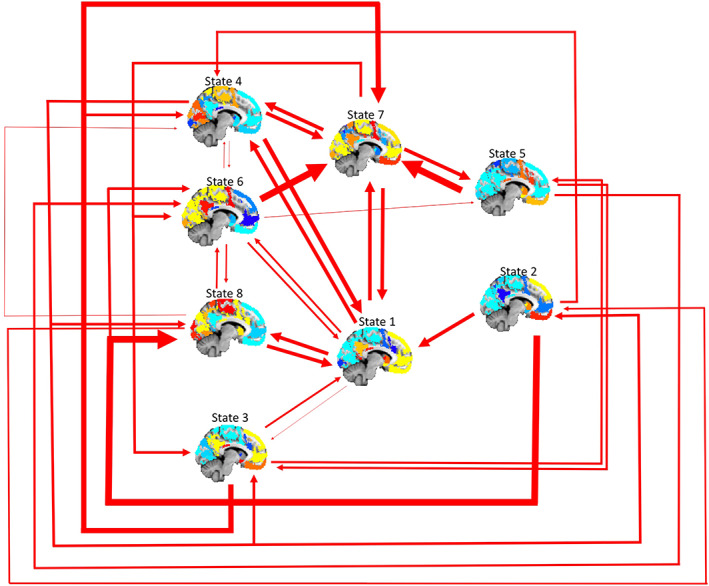
Figure 8.

Visual summarization of transitions between transient network states. The middle column of brain states are the two most frequently transitioned‐into states, while the left most and right most columns represent moderate and infrequent transition states respectively. Thicker arrows represent more frequent transitions, while thinner arrows represent relatively few transitions. Specific values and statistics regarding state dynamics can be found in the supplement [Color figure can be viewed at http://wileyonlinelibrary.com]
