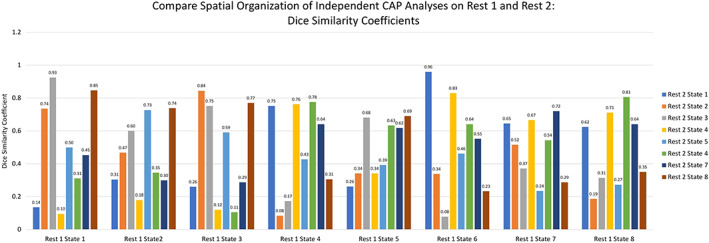
Figure 9.

Dice Similarity Coefficients representing correspondence in states between REST1 and REST2. Values closer to 1 indicate higher spatial overlap in regions showing above‐within‐network‐average activation [Color figure can be viewed at http://wileyonlinelibrary.com]
