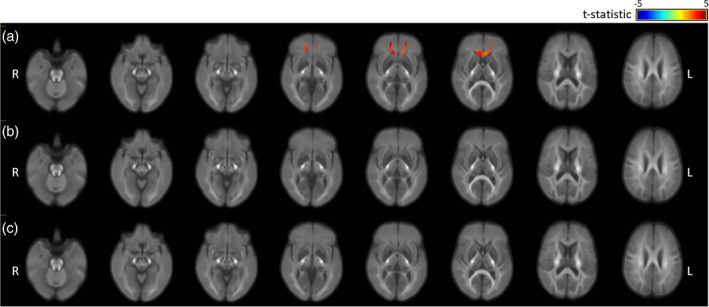
Figure 1.

Fixels showing significant differences in the fibre density (FD), fibre‐bundle cross section (FC) and FD and bundle cross section (FDC) of the traumatic brain injury (TBI; all TBI) and control groups, controlling for age and sex (all analyses) and brain volume (FC and FDC), and colour coded by effect size (t‐statistic, thresholded at p < .05): (a) FD, (b) FC, and (c) FDC
