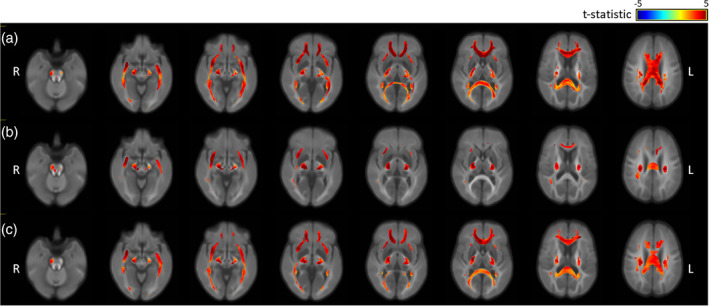
Figure 3.

Fixels showing significant differences in the fibre density (FD), fibre‐bundle cross section (FC) and FD and bundle cross section (FDC) of the moderate–severe TBI and control groups, controlling for age and sex (all analyses) and brain volume (FC and FDC), and colour coded by effect size (t‐statistic, thresholded at p < .05): (a) FD, (b) FC, and (c) FDC
