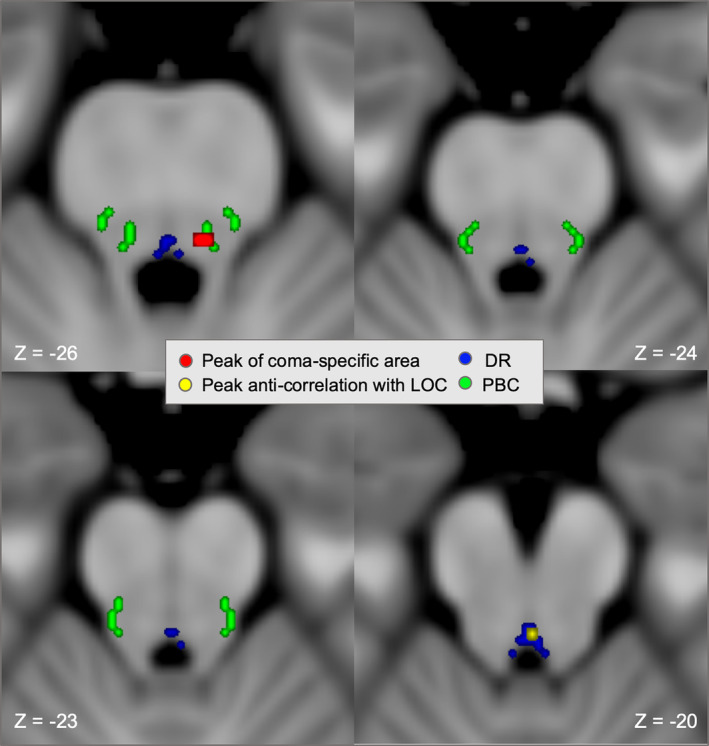
Figure 7.

Coma specific area and peak brainstem cluster overlap distinct arousal nuclei. Axial slices of brainstem showing the peaks of the coma‐specific area and the current brainstem cluster are overlaid on an MNI atlas of brainstem arousal nuclei (https://www.nmr.mgh.harvard.edu/resources/aan-atlas). The peak of the coma‐specific brainstem region (MNI ‐5, ‐35, ‐26, red, peak voxels from Figure 6a) overlaps the parabrachial complex (green), while the peak of the brainstem cluster functionally connected to loss of consciousness (LOC)‐producing cortical lesions (MNI 0, ‐34, ‐20, yellow, peak voxel from Figure 6b) overlaps the dorsal raphe (blue)
