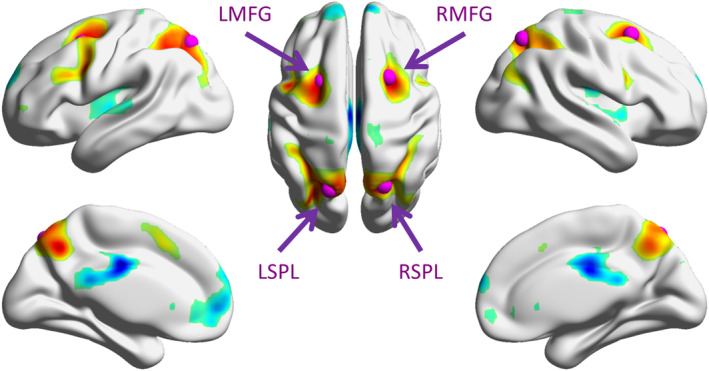
Figure 1.

Increased (warm color) and decreased (cold color) activations in the 2‐back condition compared with the 1‐back condition. The map was thresholded at p < .001 (two‐tailed) with cluster‐level false discovery rate of p < .05. The purple spheres illustrate the four regions of interest used in the physiophysiological interaction (PPI) analysis. The surface presentation was made by using BrainNet Viewer (RRID: SCR_009446; Xia, Wang, & He, 2013). LMFG, left middle frontal gyrus; RMFG, right middle frontal gyrus; LSPL, left superior parietal lobule; and RSPL, right superior parietal lobule
