
Figure 2.
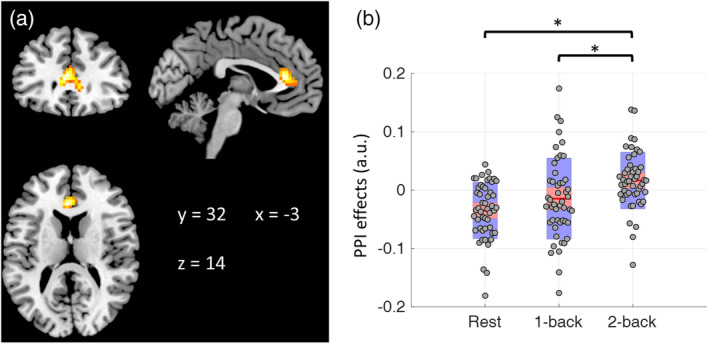
(a) Region that showed different modulatory interactions with right middle frontal gyrus (RMFG) and right superior parietal lobule (RSPL) among the three task conditions (repeated measure one‐way analysis of variance, ANOVA). The map was thresholded at p < .001 with cluster‐level false discovery rate (FDR) of p < .05. (b) Mean modulatory interactions of the cluster in the three conditions. The center red lines represent the mean effects, and the light red bars and light blue bars represent 95% confidence interval and standard deviation, respectively. Asterisk indicates statistical significance in post hoc pair‐wise comparisons at p < .05. Panel b was made by using notBoxPlot (https://github.com/raacampbell/notBoxPlot). au., arbitrary unit