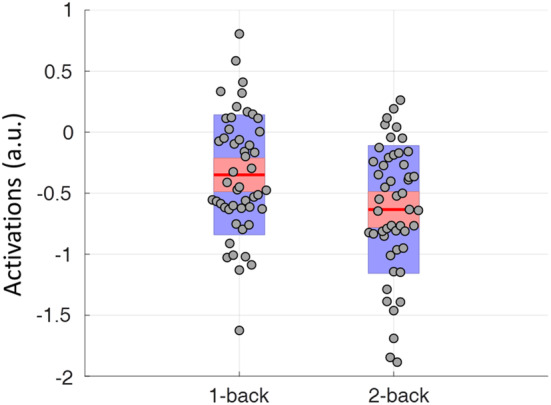
Figure 4.

Mean task activations of the anterior cingulate cortex (ACC) cluster in the block‐designed runs. The center red lines represent the mean effects, and the light red bars and light blue bars represent 95% confidence interval and standard deviation, respectively. This figure was made by using notBoxPlot (https://github.com/raacampbell/notBoxPlot). a.u., arbitrary unit
