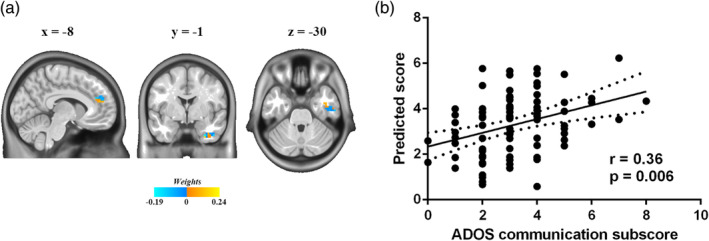
Figure 3.

Relationships between abnormal contralateral dynamic functional connectivity density (dFCD) variance and autism symptom severity. (a) Voxel‐level weightings in prediction analysis of Autism Diagnostic Observation Schedule (ADOS) communication subscore. (b) Relationships between ADOS communication subscore and predicted scores using abnormal contralateral dFCD variance (r = .36, p = .006) [Color figure can be viewed at http://wileyonlinelibrary.com]
