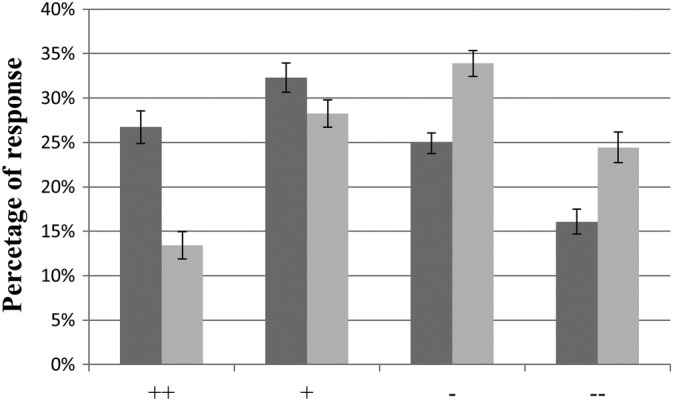
Figure 1.

Behavioral data: Percentages of responses (mean ± SE) for strongly positive (++), slightly positive (+), slightly negative (−), strongly negative (−−) social intent attributions of visual (dark gray) and acoustic (light gray) laughter stimuli
