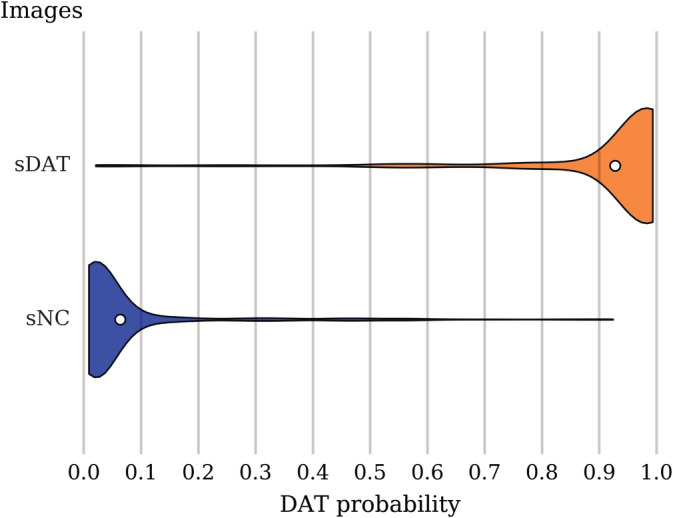
Figure 2.

DAT probability score distribution among the sNC and sDAT test images. The violin plot shows the density (relative proportion of images), while the white dot gives the mean probability. A threshold of 0.5 leads to classification accuracy of 93.5%, sensitivity of 92.3%, specificity of 94.2%, and AUC of 0.976. sDAT, stable Dementia of the Alzheimer's type; sNC, stable normal control
