
Figure 3.
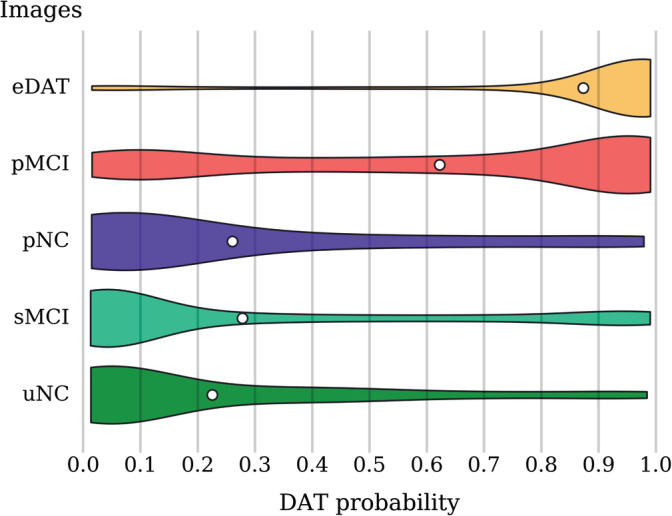
DAT probability score distribution among all the independent test images from the uNC, sMCI, pNC, pMCI, and eDAT subgroups. The violin plot shows the density (relative proportion of images), while the white dot gives the mean probability score. Most of the eDAT images are clustered around the high probability scores. The pMCI images exhibit bimodal clustering with a dominant cluster around higher probability scores and another cluster around lower probability scores. The pNC, sMCI, and uNC images are clustered mainly around lower probability scores. DAT, Dementia of the Alzheimer's type; pMCI, progressive mild cognitive impairment; pNC, progressive normal control; sMCI, stable mild cognitive impairment; uNC, unstable normal control