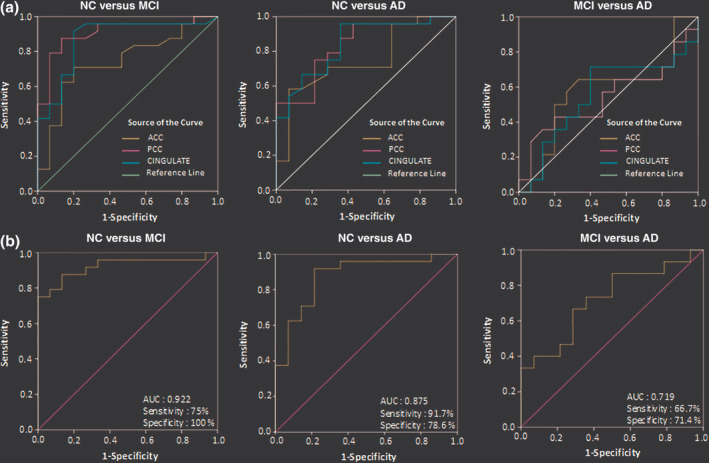
Figure 6.

Diagnostic accuracy test using ROC curves for the independent ACC, PCC, and CINGULATE (includes ACC and PCC regions from the same participant) in age‐matched control (NC), MCI, and AD as independent study groups using (a) GSH‐closed form (GSHcl) concentration level as single variable in ACC, PCC, and CINGULATE regions, and (b) multivariate ROC analysis on GSHcl concentration levels to indicate combined hypometabolism effect of ACC and PCC regions on the disease diagnosis of MCI and AD from the NC, and MCI from AD. Abbreviations: ACC, anterior cingulate cortex; AD, Alzheimer's disease; GSH, glutathione; MCI, mild cognitive impairment; NC, normal control; PCC, posterior cingulate cortex containing; ROC, receiver operator characteristic
