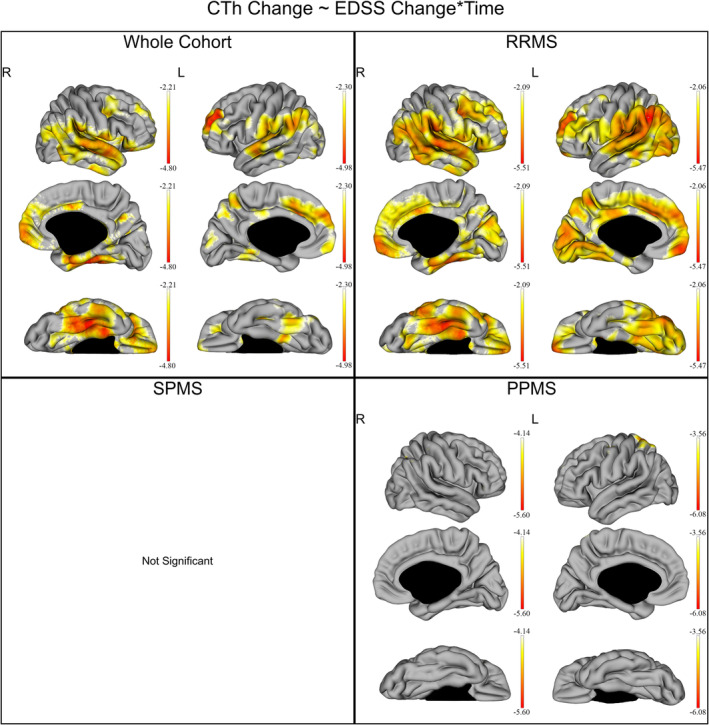
Figure 5.

Correlation between EDSS and CTh changes over time in the whole cohort and individual subgroups of disease subtypes. The gradient from yellow to red indicates a weaker to stronger negative correlation respectively, as shown by the t‐values extracted from our linear mixed effect models. In each graph, the highest (or less negative) gradient value represents the threshold of the respective t‐values after correction with the false discovery rate approach for multiple comparisons set at q < 0.05. Up left: correlation between EDSS and CTh changes over time in the whole cohort. Up right: correlation between EDSS and CTh changes over time in the relapsing remitting multiple sclerosis (RRMS). Down left: no statistically significant correlation was shown between EDSS and CTh changes over time in the secondary progressive multiple sclerosis (SPMS). Down right: correlation between EDSS and CTh changes over time in the primary progressive multiple sclerosis (PPMS)
