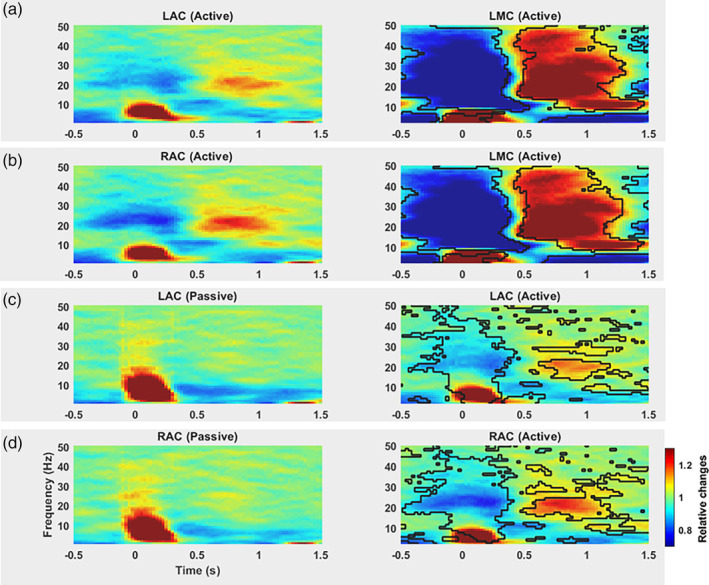
Figure 2.

Grand averaged time–frequency spectrogram and statistical comparisons of oscillatory power in the motor cortex and auditory cortices. Rows 1 and 2: Time–frequency spectrograms show beta modulation in LMC, LAC, and RAC voxels in the active condition. The statistical test revealed significant changes in beta‐band power in LMC voxel in the active condition as compared to LAC and RAC voxels in the active condition (a and b, right panels). The resulting time–frequency clusters with cluster‐level p‐values below an alpha level of .05 (obtained from the statistical analysis) are considered significant and designated by black contour on the right spectrograms. Rows 3 and 4: Only left and right time–frequency maps of auditory cortices in the active conditions show beta modulations. Significant changes (p < .05) were found in beta‐band activity in LAC and RAC voxels (c and d, right panel) for the active condition as compared to passive condition. Colour codes the normalised power by computing relative changes with reference to the mean power from −2 to 2 s. Time point 0 s marks tone presentation onset. LAC and RAC, left auditory cortex, LMC, left motor cortex; RAC, right auditory cortex
