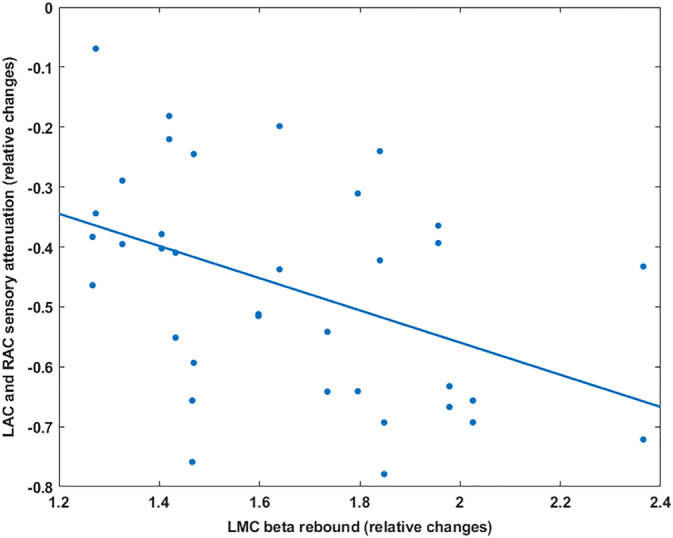
Figure 3.

Scatterplot of the LMC beta rebound (x‐axis) and the LAC and RAC sensory attenuation (y‐axis). The blue line indicates the fitted linear regression. The increase of beta rebound in the left motor cortex leads to stronger sensory attenuation in the auditory cortices. LAC and RAC, left auditory cortex, LMC, left motor cortex; RAC, right auditory cortex
