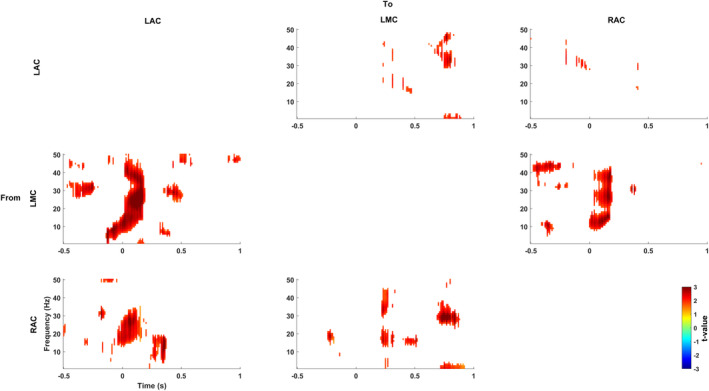
Figure 4.

Results of Granger causality analysis. Granger causality differences between the original and time‐reversed data in motor and auditory areas for the active condition. There is significant Granger causality in the alpha/beta range from the motor area to both left and right auditory areas. Colour codes t values. Time point 0 s marks tone presentation onset
