Figure 2.

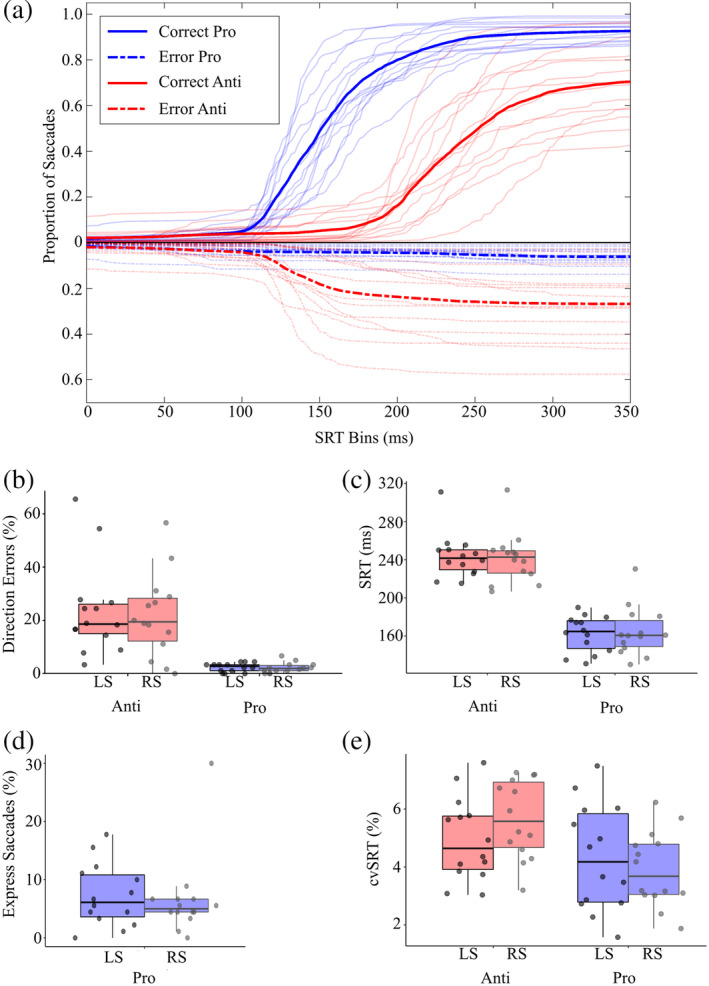
Eye movement behavioral data. (a) Cumulative histograms of SRT for prosaccade (light gray) and antisaccade (black) saccade distributions for all participants (thin lines) and the group average (thick lines). Positive Y values indicate correct saccades (solid lines), whereas negative Y vales indicate direction errors (dashed lines). (b) Mean percentage of direction errors (a saccade away from stimulus on prosaccade trial, toward stimulus on antisaccade trial) for stimuli on the left side (LS) and right side (RS). (c) Mean SRTs on correct trials for stimuli on the LS and RS. (d) Mean percentage of express saccades (90–135ms) for stimuli on the LS and RS. (e) Mean inter‐participant coefficient of variation in SRT (cvSRT) for stimuli on the LS and RS. SRT, saccade reaction time
