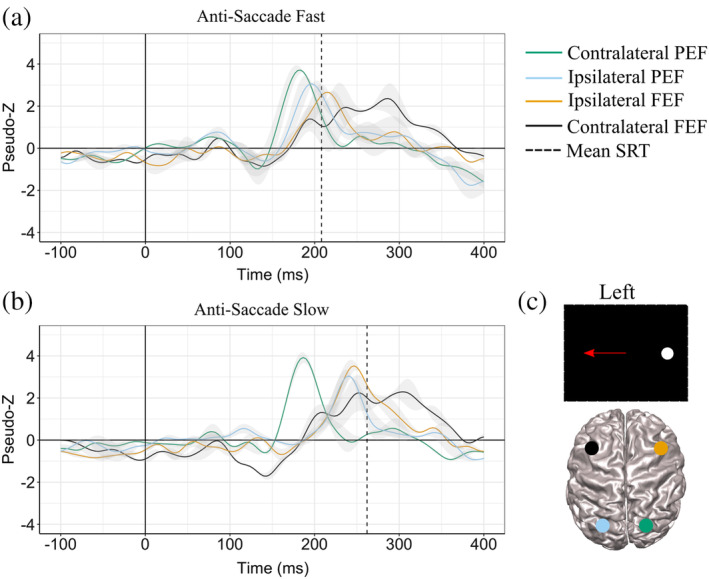
Figure 7.

ERB Virtual‐Sensors (1–30Hz) from stimulus aligned antisaccade trials (where 0 in the above plots are stimulus onset). Plots show contralateral and ipsilateral PEF and FEF time courses for fast (a) and slow (b) trials averaged over left and right stimulus. Group median fast SRT is the black vertical dashed line in (a) and group median slow SRT is the black dashed vertical line in (b). (c) Is a representation of contralateral and ipsilateral PEF and FEF areas during left stimulus trial. ERB, event‐related beamforming; FEF, frontal eye field PEF; PEF, parietal eye field; SRT, saccade reaction time
