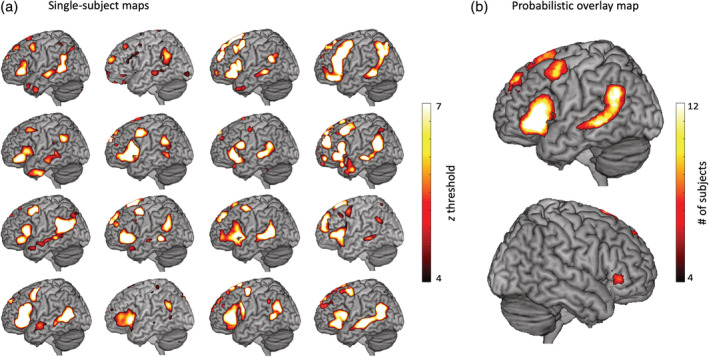
Figure 2.

(a) Language network maps for all 16 subjects. (b) Probabilistic overlay map showing locations of high convergence across subjects. Cases 2, 12 and 14 had their minimum threshold set to z = 3 for illustration purposes [Color figure can be viewed at http://wileyonlinelibrary.com]
