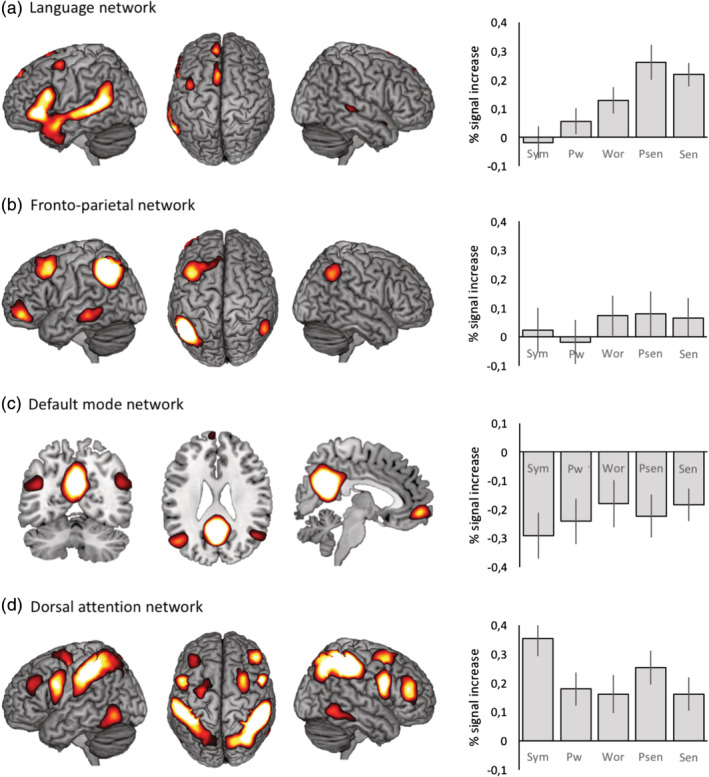
Figure 3.

Group‐level resting‐state functional magnetic resonance imaging networks and corresponding mean percent signal changes for each condition. Psen, pseudosencentes; Pwor, pseudowords; Sen, sentences; Sym, symbols; Wor, words. Vertical bars denote 95% confidence intervals [Color figure can be viewed at http://wileyonlinelibrary.com]
