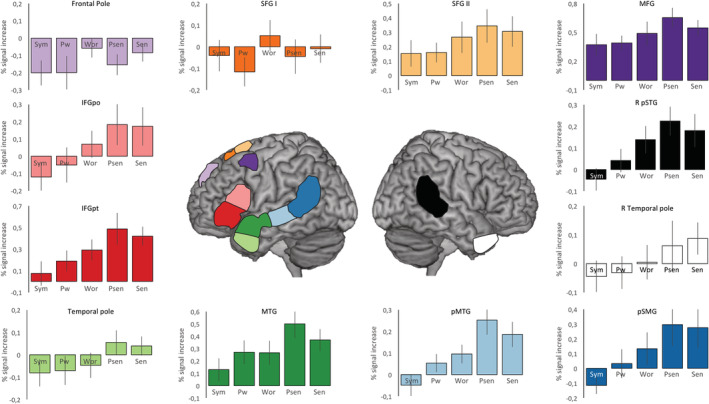
Figure 4.

Mean percent signal changes for each condition, for each of the 12 region‐of‐interests (ROIs) used to examine the language network. Bar graphs are color‐coded in respect to each ROI in the center figure. Vertical bars denote 95% confidence intervals. Psen, pseudosencentes; Pwor, pseudowords; Sen, sentences; Sym, symbols; Wor, words. Vertical bars denote 95% confidence intervals [Color figure can be viewed at http://wileyonlinelibrary.com]
