Figure 3.

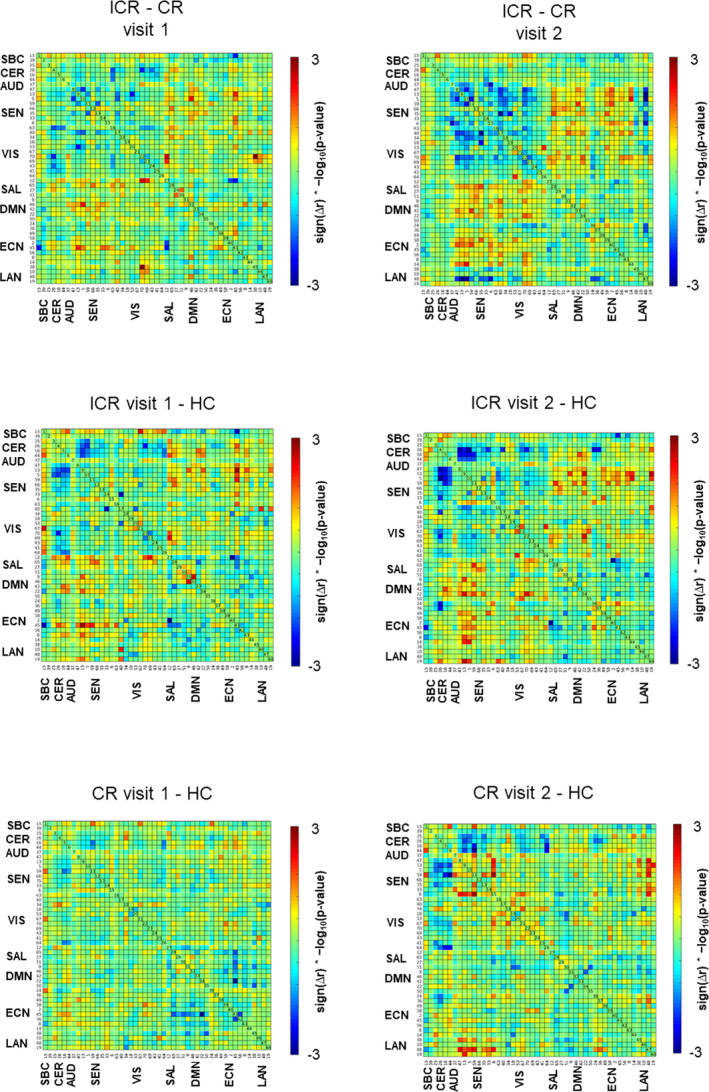
Group differences in static FNC displayed as sign(mean difference in correlation) * −log10(uncorrected p‐values). Blue vertices in the matrices show trends toward decreased static FNC, red vertices reflect trends toward increased FNC

Group differences in static FNC displayed as sign(mean difference in correlation) * −log10(uncorrected p‐values). Blue vertices in the matrices show trends toward decreased static FNC, red vertices reflect trends toward increased FNC