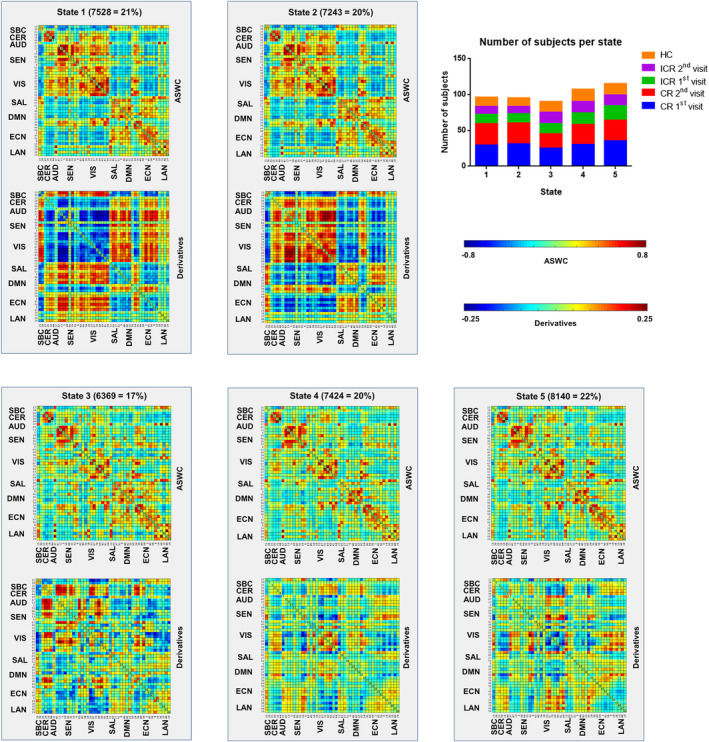
Figure 4.

Centroids of the five dFNC‐states for the total group of participants (TBI and HC). Per state the number of windows as well as the percentage of total windows assigned to that particular state across all participants is depicted. The top right graph shows the number of subjects visiting each state for the TBI (first and second visit) and HC groups
