
Figure 5.
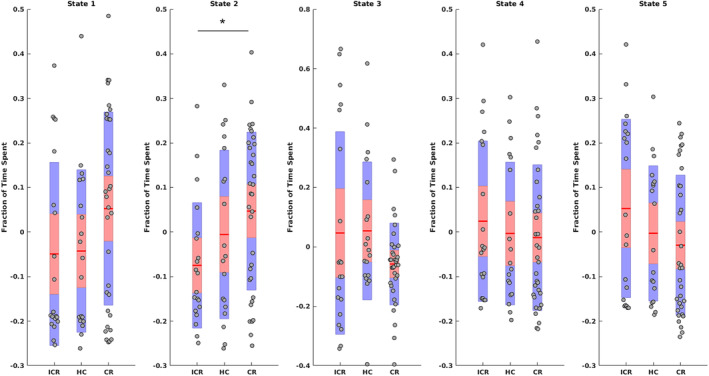
Fraction of time spent per state for patients with ICR and CR during the second visit, and HC. Mean, 95% confidence interval, and one standard deviation are shown. Asterisk (*) indicates a significant group difference after FDR correction. Note that because age was regressed out of the data, values can be negative