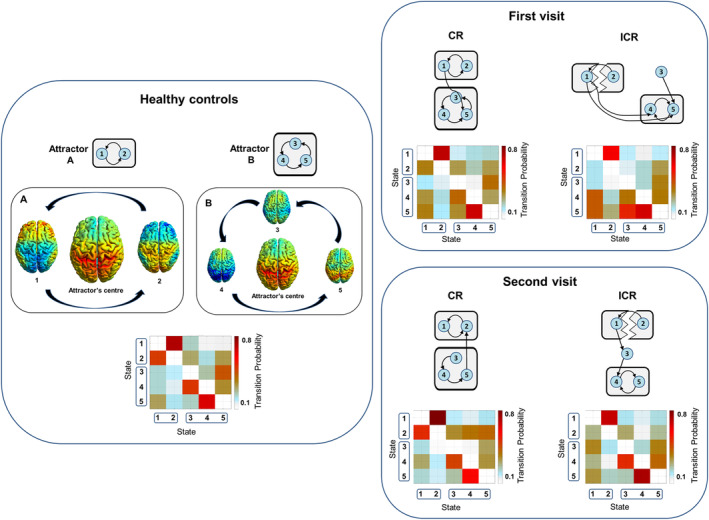
Figure 7.

State transition probabilities and schematic representations of attractors for patients with ICR and CR and HC. Additional rendered brain images show aggregated component T‐maps weighted based on the values in the attractor's ASWC‐ and derivative‐centroids (i.e., component's T‐map * [sum of all values for that component in the centroid, with subsequent variance normalization]). Red and blue colors in the attractor's center image reflect components with positive and negative correlations, respectively. In the surrounding state images, red and blue reflect time‐related (i.e., over windows) increasing and decreasing correlations, which are based on the derivatives. Thus, there are oscillating patterns of connectivity, orbiting an attractor's center. These patterns are disrupted in patients with ICR
