
Figure 4.
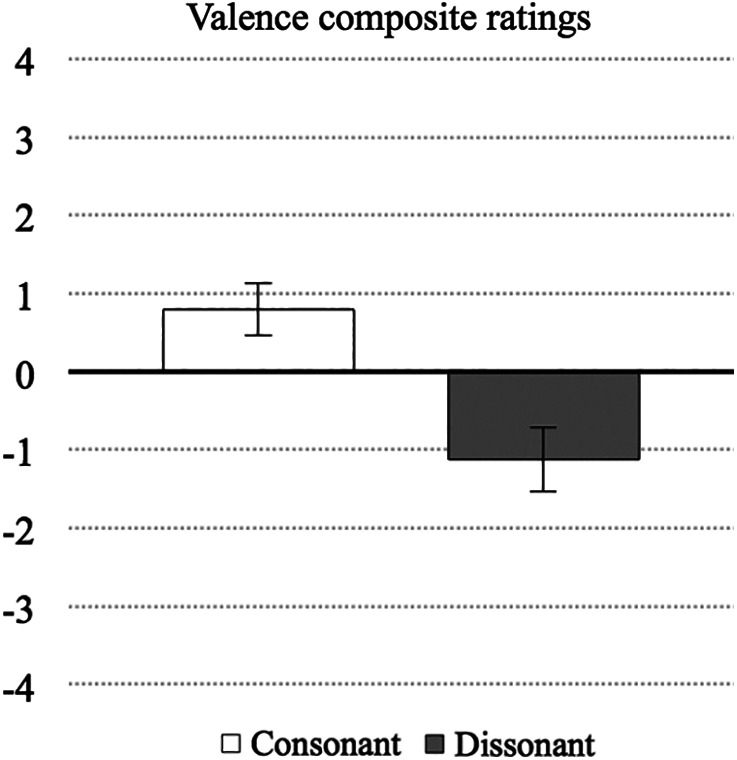
Valence ratings (y‐axis) for the consonant and dissonant music conditions (x‐axis). Error bars show 95% confidence intervals [adjusted for repeated measures following the method proposed by Loftus & Masson, 1994]
Official websites use .gov
A
.gov website belongs to an official
government organization in the United States.
Secure .gov websites use HTTPS
A lock (
) or https:// means you've safely
connected to the .gov website. Share sensitive
information only on official, secure websites.
Valence ratings (y‐axis) for the consonant and dissonant music conditions (x‐axis). Error bars show 95% confidence intervals [adjusted for repeated measures following the method proposed by Loftus & Masson, 1994]