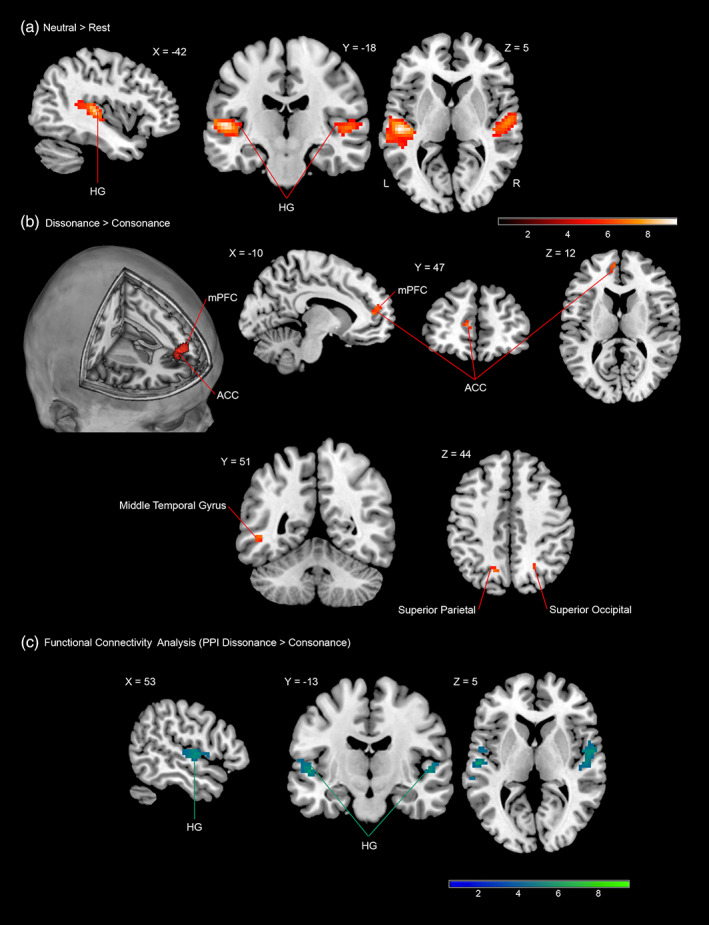
Figure 5.

FMRI results (FWE‐corrected p < .05 for cluster‐level inference). Coloured areas (red) reflect: (a) statistical parametric maps (SPM) of the direct contrast between the neutral condition and rest superimposed onto a standard brain in stereotactic MNI space. Similar patterns of brain response were found for the contrasts: dissonance > rest and consonance > rest; signal changes were observed bilaterally in primary and secondary auditory cortices including Heschl's gyri (HG) bilaterally (sagittal, coronal and axial views). (b) Statistical parametric maps showing voxels in the left medial prefronal cortext (mPFC) and left rostral anterior cingulate cortex (ACC) in which the response was higher during dissonant music compared to consonant music (3D rendering sagittal oblique, sagittal, coronal and axial views). This contrast also evidenced signal differences (at uncorrected p < .001 for voxel‐level inference) in the left superior parietal, right superior occipital, and left middle temporal gyrus (coronal and axial views). (c) Blue colour identifies voxels in both the left ant right primary auditory cortex, which exhibited stronger functional connectivity with seed voxels (6 mm sphere) located in the left rostral anterior cingulate cortex during the dissonant condition compared with the consonant condition
