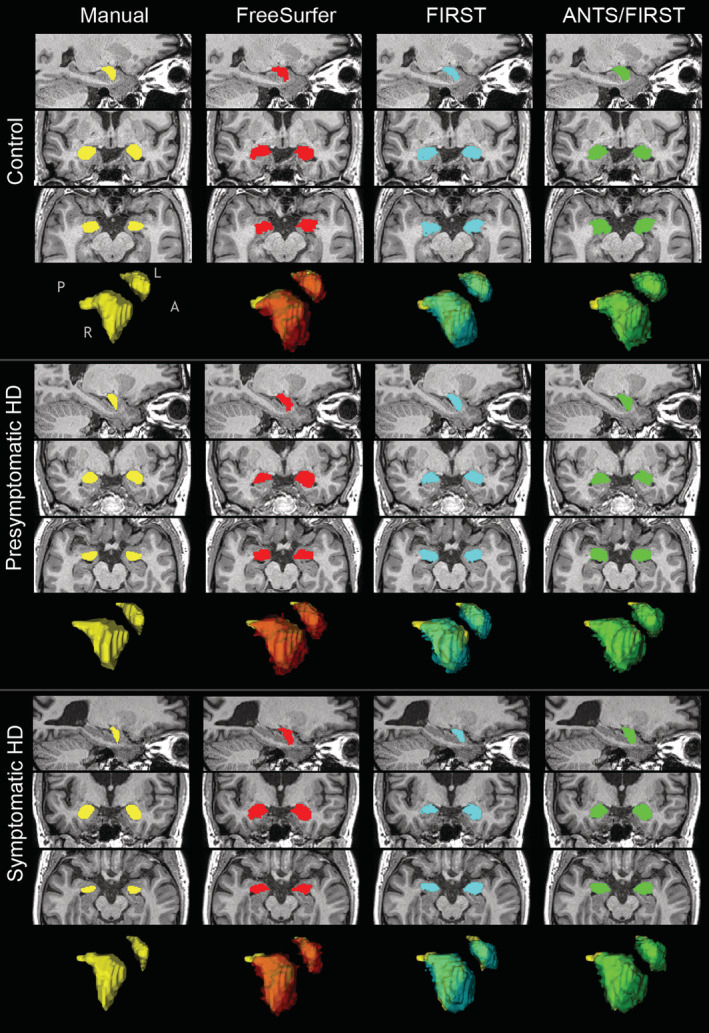
Figure 1.

Examples of segmentations resulting from each technique, for a single participant from each group. Sagittal, coronal, and axial slices are displayed for each combination of participant and segmentation technique, shown in neurological orientation (left is left). Surface mesh representations of segmented amygdala based on each technique are displayed for the same individual participants. Yellow meshes are manual segmentations. Red, blue, and green meshes are for automated techniques, and are overlaid on the manually segmented meshes to illustrate differences in morphology. Anatomical axis descriptors: ‘A’ = anterior, ‘L’ = left, ‘P’ = posterior, ‘R’ = right
