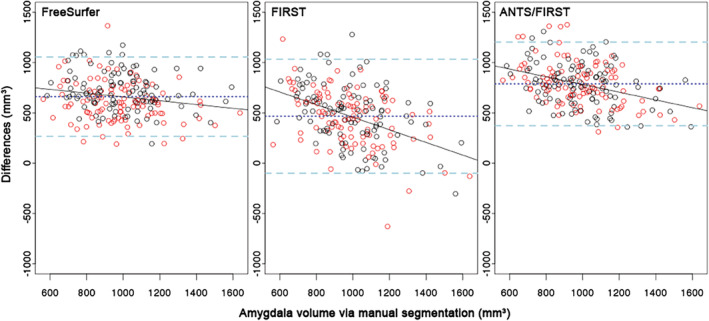
Figure 5.

Bland–Altman plots of amygdala volume for each automated segmentation technique, versus manual segmentation, for all groups combined. X‐axis: manually segmented amygdala volume. Y‐axis: difference in amygdala volume between manual segmentation and the automated segmentation. Red: left amygdala. Black: right amygdala. Dark blue line: mean difference. Light blue lines: upper and lower limits of differences, that is, mean difference ± 1.96 × SD. Black line: regression line from linear model
