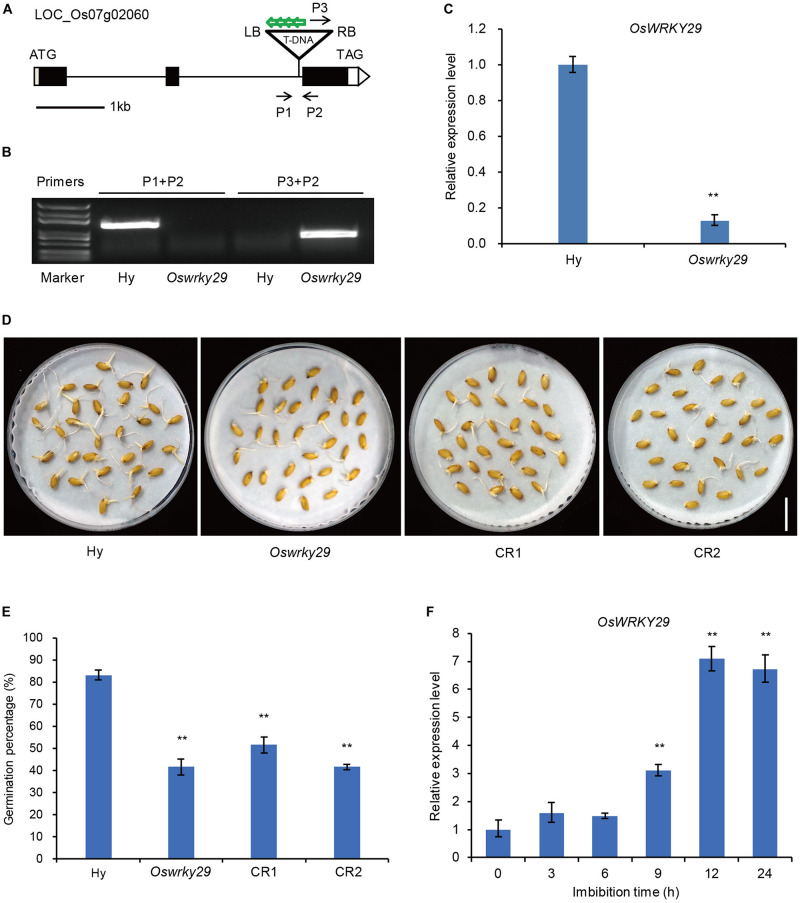
FIGURE 1.
Seed dormancy phenotypes of Oswrky29 T-DNA insertion mutant. (A) T-DNA insertion site in Oswrky29 (LOC_Os07g02060) mutant is indicated by a triangle. Black boxes indicate exons, lines indicate introns, and white boxes indicate the untranslated regions. P1, P2, and P3 are the primers used to identify the T-DNA insertion site. Green arrows indicate four copies of 35S enhancers in the T-DNA insertion sequence. RB and LB indicate the right and left borders of the T-DNA insertion. (B) Identification of the T-DNA insertion by PCR. The primers are labeled in panel (A). (C) RT-qPCR of the OsWRKY29 transcript in Hwayoung (Hy) and Oswrky29 seeds. Fresh seeds were collected at 45 days post heading for RT-qPCR analysis. Values are means ± SD (n = 3). The Student’s t-test analysis indicates a significant difference (**P < 0.01). (D) Seed germination phenotypes of Hy, Oswrky29 mutant and OsWRKY29-CRISPR transgenic lines CR1 and CR2. Fresh seeds were collected at 45 days post heading for germination test. Scale bar, 2 cm. (E) Germination percentages for Hy, OsWRKY29 mutant, CR1 and CR2. Fresh seeds were collected at 45 days post heading for germination test. Values are means ± SD (n = 3), 30 seeds were measured in each replicate. The Student’s t-test analysis indicates a significant difference (**P < 0.01). (F) Analysis of OsWRKY29 expression levels during seed imbibition in water determined by RT-qPCR. Fresh seeds were collected at 45 days post heading and imbibition in water. RT-qPCR was performed at the indicated times. Values are means ± SD (n = 3). The Student’s t-test analysis indicates a significant difference (**P < 0.01).

