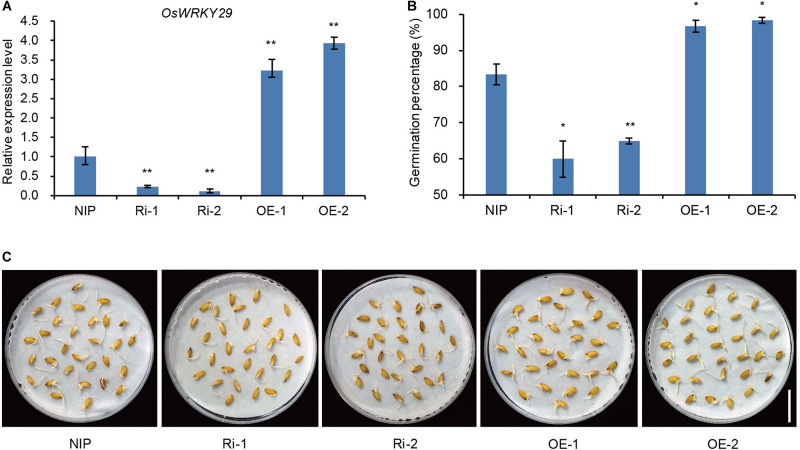
FIGURE 2.
Seed dormancy phenotypes of OsWRKY29 transgenic plants. (A) OsWRKY29 expression levels in seeds of the NIP, OsWRKY29 Ri and OE lines determined by RT-qPCR. Fresh seeds were collected at 45 days post heading for RT-qPCR analysis. Values are means ± SD (n = 3). The Student’s t-test analysis indicates a significant difference (**P < 0.01). (B) Seed germination percentages of NIP, OsWRKY29 Ri and OE lines after five days of imbibition. Fresh seeds were collected at 45 days post heading for germination test. Values are means ± SD (n = 3), 30 seeds were measured in each replicate. The Student’s t-test analysis indicates a significant difference (*P < 0.05, **P < 0.01). (C) Seed dormancy phenotypes of NIP, OsWRKY29 Ri and OE lines after five days of imbibition. Fresh seeds were collected at 45 days post heading for germination test. Scale bar, 2 cm.

