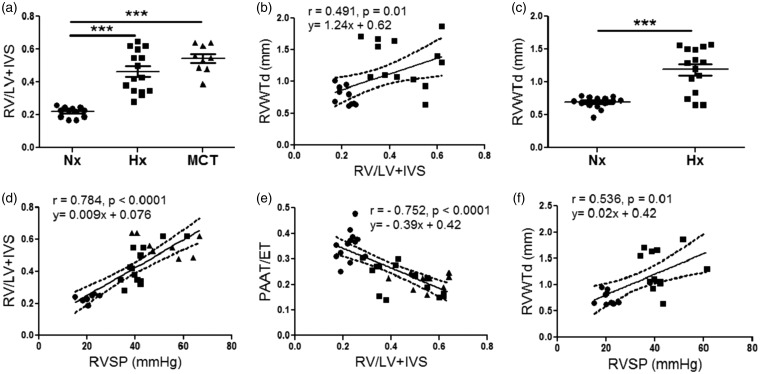
Fig. 3.
Derivation phase, correlation of invasive and non-invasive measures of pulmonary hemodynamics (RVSP), and RVH (FI and RV/BW). (a) FI in normoxic, hypoxic, and MCT-treated rats, n = 9–15 per group. (b) Correlation between RVWTd and FI (r = 0.491, p = 0.01), n = 25. (c) RVWTd in normoxic and hypoxic, n = 15–16 per group. (d) Correlation between FI and RVSP (r = 0.784, p < 0.0001), n = 30. (e) Correlation between PAAT/ET with FI (r = –0.707, p < 0.0001), n = 36. (f) Correlation between RVWTd and RVSP (r = 0.536, p = 0.01), n = 21. Each data point represents one animal, circles reflect control animals, squares hypoxic, and triangles MCT animals. ***p < 0.001 compared to normoxic or vehicle-treated controls. Dashed lines represent 95% confidence intervals (b, d–f).
RV: right ventricle; LV: left ventricle; IVS: intraventricular septum; RVWTd: right ventricular wall thickness in diastole; RVSP: right ventricular systolic pressure; PAAT/ET: pulmonary arterial acceleration time/ejection time.

