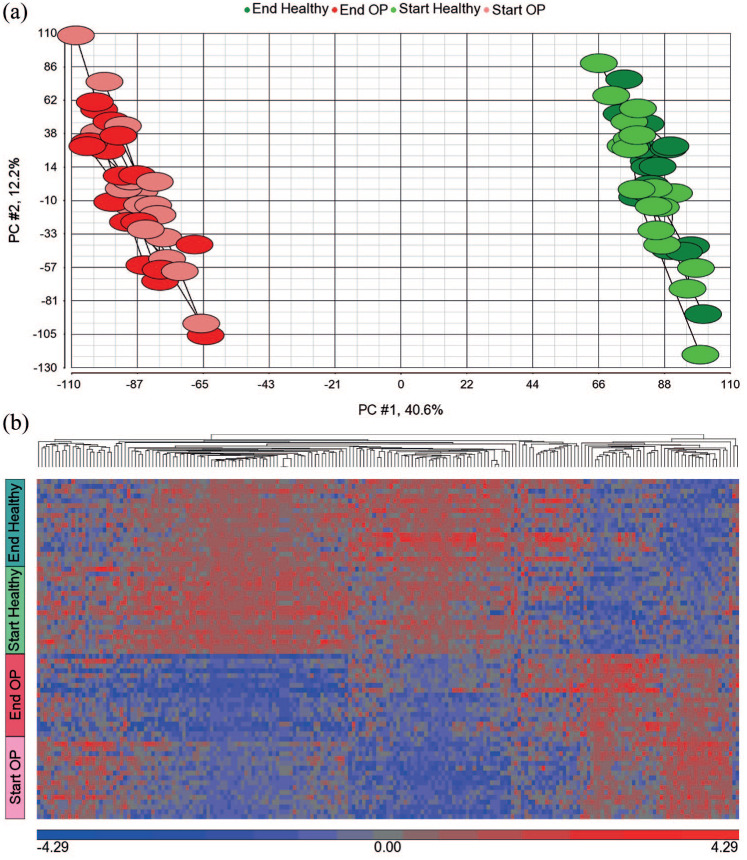
Figure 3.
Changes in muscle transcript levels after exercise.
(a) Principal component 1 versus principal component 2 from a PCA using all available (genome-wide) muscle mRNA transcripts (n = 18,811), showing two non-overlapping clusters. Green and light-green colours represent post- and pre-exercise healthy women, respectively. Red and pink colours represent post- and pre-strength-training osteoporotic women, respectively; (b) supervised cluster analysis of muscle transcript levels of 18 healthy and 17 osteoporotic women representing 70 samples, before and after strength training. The heat map shows 308 transcripts with differential expression (FDR < 5%) pre versus post-strength training in healthy and/or osteoporotic women identified by repeated-measures ANOVA ignoring disease status. Separate genes whose transcripts show down- (blue) or up-regulation (red) regulation. The colour bar (blue/red) below the heat map represents gene expression standardized to a mean of zero and standard deviation of one of log2 signal values.
ANOVA, analysis of variance; FDR, false discovery rate; mRNA, messenger ribonucleic acid; OP, osteoporotic; PC, principal component; PCA, principal component analysis.

